
One Team, One Decision: Knowledge Worker Analytics for Managers
Knowledge worker analytics measures how professionals gather, synthesize, and act on unstructured information to make judgement-heavy decisions, not how quickly they complete routine tasks. It matters now because most organizational data is messy and unstructured, and the workers who make sense of it fastest tend to make the best decisions. The rest of this article covers where it delivers real gains, where AI-assisted analytics breaks down, and how to pilot it without guessing.
TL;DR:
- Knowledge worker analytics effectively surface expertise and decision patterns in unstructured, messy organizational data, primarily supporting synthesis and prioritization tasks.
- Its success relies on pilot projects with a clear hypothesis, focusing on proven frontier tasks, and scaling only after measurable improvements are established.
- The approach requires strict data governance, privacy safeguards, and integration into existing decision systems to avoid silos and ensure trust in insights.
- KPIs should measure decision speed, expertise discovery, process deviations, knowledge reuse, and decision stability, not just traditional productivity metrics.
- Human judgment must remain active through provenance tracking and safeguards, especially for tasks just outside AI’s reliable zone, to prevent deskilling and maintain decision quality.
Table of Contents
- What is knowledge worker analytics?
- How does analytics help knowledge workers make better decisions?
- Where does AI-driven analytics fail knowledge workers?
- How do you implement knowledge worker analytics?
- A working example: process discovery in practice
- Building data literacy for knowledge workers
- Integrating analytics with the systems you already have
- What KPIs matter for knowledge worker analytics?
- Where has this actually worked?
- Keeping knowledge worker data private and secure
- What’s next for knowledge worker analytics?
- Priorities and pitfalls from an operator’s view
- How Patterns Process Finder helps you get there
- Sources
- FAQ
What is knowledge worker analytics?
Knowledge worker analytics blends activity data, content signals, and situational context to support decisions that don’t follow a script, things like diagnosing a client’s real problem, prioritizing which of twelve stalled deals to chase, or synthesizing a stack of interview notes into a recommendation. That’s a different animal from traditional operational analytics, which tracks information workers completing repeatable, rule-based tasks (call volume, ticket resolution time, units processed).
Business intelligence dashboards were built for that world: structured tables, clean fields, predictable outputs. Knowledge work runs on the opposite. Research into generative AI tools for knowledge workers estimates a large share of organizational data is messy and unstructured, scattered across emails, meeting notes, PDFs, and Slack threads with no consistent schema. Knowledge worker analytics exists specifically to make that mess legible, surfacing patterns in how expertise gets applied rather than just counting outputs. That distinction shapes every metric and tool choice covered below.
How does analytics help knowledge workers make better decisions?
The clearest use cases cluster around synthesis and prioritization. Managers use knowledge worker analytics to find who actually holds expertise on a topic (not who has the title), to compress dozens of customer interviews or compliance reports into a decision-ready brief, and to spot which version of a “standard” process teams are quietly running instead.
The productivity case is measurable, at least for tasks that play to AI’s strengths. A large field experiment found workers with generative AI access cut time spent on tasks like reading emails and drafting documentation, freeing hours for the judgement calls that actually move outcomes. That gain shows up reliably on well-bounded tasks. It does not automatically transfer to open-ended strategic work, a distinction the next section covers in detail.
Signals worth tracking as proxies for otherwise invisible work include:
- Digital work activity, the system and app interactions that form the measurable substrate of knowledge work.
- Content engagement patterns, which documents get reused, cited, or abandoned.
- Collaboration metadata, who consults whom before a decision ships.
- Process variant frequency, how often teams deviate from the documented steps.
Statistic to know: the share of skilled knowledge workers freelancing in the U.S. increased significantly between 2025 and 2026, according to Upwork’s Future Workforce Index. AI is making specialized expertise easier to package and sell independently, which raises the bar for how well internal teams need to document and measure their own knowledge work to stay competitive.
Where does AI-driven analytics fail knowledge workers?
The honest answer: unevenly. Harvard Business School’s field experiment on the “jagged technological frontier” found AI-aided groups completed more tasks faster and with higher quality on tasks inside AI’s capability zone, but performed measurably worse on select tasks just outside it. The frontier isn’t obvious from the outside. A task that looks similar to one AI handles well can sit just past the edge, and workers who trust the output anyway make worse calls than if they’d had no AI assistance at all.
That’s where deskilling risk creeps in. When workers defer to AI-generated recommendations without their own reasoning intact, judgement atrophies. One response to this is what researchers call Intelligent Decision Assistance (IDA), tools designed to support reasoning rather than replace it, keeping the human’s judgement active instead of outsourcing it wholesale.
Practical safeguards worth building into any analytics rollout:
- Require provenance tags on AI-assisted outputs, so reviewers know what came from a model versus a person.
- Keep human-in-the-loop validation on any decision outside a clearly mapped frontier task.
- Train teams to recognize the edge of AI’s reliable zone, not just its capabilities.
Pro Tip: Map your team’s tasks into two buckets, “inside the frontier” and “unproven,” before you roll out any AI-assisted analytics tool. Treat the unproven bucket as human-led until you have evidence otherwise.
How do you implement knowledge worker analytics?
Start with a hypothesis, not a dashboard. APQC’s Knowledge Analytics framework recommends anchoring any measurement effort to a specific business question, like “does faster expertise discovery shorten proposal cycles?”, rather than tracking activity for its own sake. A metric with no decision attached to it is just noise with a chart around it.
1. Identify and protect your data sources. Document repositories, collaboration metadata, digital work activity logs, and process capture tools all qualify, but each carries privacy exposure. Anonymize where the analysis doesn’t require identifying individuals.
2. Choose your synthesis method. Transform unstructured text into comparable structures, cluster similar decisions or documents, and flag process variants and exceptions where teams deviate from the documented steps.
3. Build for data literacy. No-code platforms let managers explore patterns without writing queries; code-friendly platforms give analysts room to test hypotheses that no-code tools can’t express. Most teams need both.
4. Establish governance and cadence. Set a review rhythm (monthly is common) and name who owns data quality.
5. Pilot before scaling. Design patterns research on knowledge analytics tools stresses provenance and traceability as the features that most affect whether stakeholders trust the results enough to act on them.
| Pilot stage | What to do | What to measure |
|---|---|---|
| Baseline | Sample current decision speed and quality without AI assistance | Time to decision, error rate |
| Augmented test | Apply analytics only to tasks confirmed inside the AI frontier | Speed change, quality change |
| Review | Compare against baseline, flag any quality drop | Net productivity delta |
| Scale | Extend to adjacent teams using the same frontier tasks | Adoption rate, variance from pilot results |
A tool like Patterns Process Finder’s process mining platform can shortcut the variant-detection step by capturing how work actually happens instead of relying on self-reported process maps.
A working example: process discovery in practice
Most process documentation describes how work is supposed to happen. Automated discovery approaches capture how work actually happens, recording real desktop and browser activity to surface subprocess variations and client-specific rules that standard documentation misses entirely.
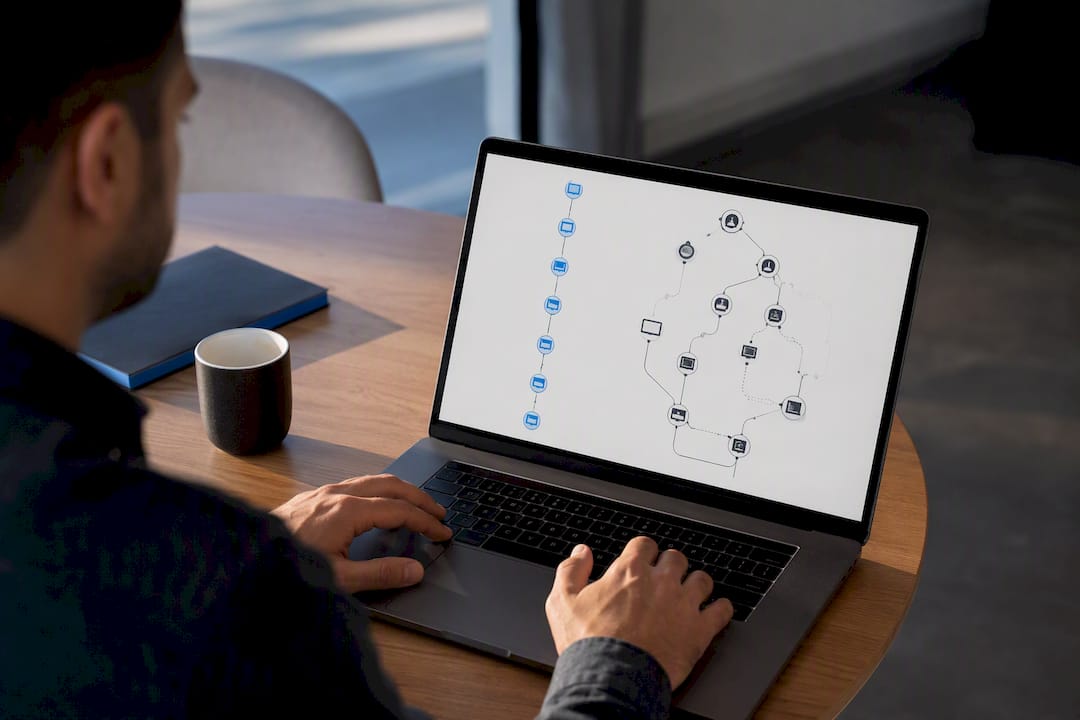
That distinction matters for analytics accuracy. A knowledge worker who “follows the approval process” might actually run four different variants depending on client type, deal size, or which exception they hit last quarter, and none of those variants show up in the official flowchart.
Patterns Process Finder’s approach, based on its own stated capabilities, includes:
- Privacy-conscious behaviour tracking that captures patterns without exposing sensitive content.
- Automated generation of living SOPs that update as real workflows shift, instead of going stale the week after they’re written.
- Detection of hidden subprocess branches and exception handling, the areas most likely to cause automation failures downstream.
Teams evaluating automation candidates can review pricing and plan details directly against their own process complexity before committing.
Building data literacy for knowledge workers
Analytics only pays off if the people using it can interpret what they’re seeing, and that’s where most rollouts stall. Handing a knowledge worker a dashboard full of clustering results does nothing if they don’t understand what a cluster means or how confident to be in it.
No-code platforms have narrowed that gap significantly. Tools built around drag-and-drop filtering and visual query builders let a marketing manager or an HR lead explore patterns in engagement or attrition data without learning SQL. That’s valuable for the majority of knowledge workers whose job is judgement, not data engineering. The trade-off is depth: no-code tools tend to answer the questions their interface anticipates, and struggle with the ones that don’t fit a template.
Code-friendly platforms, notebooks, Python-based analysis, custom query layers, solve that problem for the analysts and power users who need to test a hypothesis the standard dashboard doesn’t support. The realistic goal for most organizations isn’t choosing one over the other. It’s layering them: no-code tools for the broad population doing exploratory analysis, code-friendly tools for the smaller group building the models everyone else consumes.
Training matters more than tool selection. A team that understands what a confidence interval means, or why a correlation in collaboration data doesn’t prove causation, makes better decisions with a mediocre tool than a data-illiterate team makes with an excellent one. Build literacy training into onboarding rather than treating it as an optional workshop, and revisit it whenever a new analytics tool changes what the data actually shows.
Integrating analytics with the systems you already have
Knowledge worker analytics fails most often not because the analysis is wrong, but because it lives in a silo nobody checks. The fix isn’t a new platform. It’s connecting analytics outputs to the tools where decisions already get made.
Start by mapping where your knowledge workers actually spend their day, project management software, document repositories, CRM systems, collaboration platforms, and push analytics insights into those surfaces rather than a separate reporting tool. A sales manager reviewing deal notes should see expertise-matching suggestions inline, not in a monthly PDF nobody opens.
Data governance needs to travel with that integration. If analytics draws from collaboration metadata or document repositories, access controls and retention rules need to match whatever policy already governs those source systems, not a new policy invented for the analytics layer. Duplicated governance frameworks are how organizations end up with two conflicting answers to “who can see this.”
Version control matters more than most teams expect. When analytics identifies a better process variant, that finding needs to update the living documentation teams actually consult, not sit in a separate insights repository that drifts out of sync within a quarter. Systems that generate SOPs directly from captured workflow data avoid that drift because the documentation and the analysis share the same source.
Finally, integrate at the decision point, not the reporting point. Analytics that only appears in a quarterly business review arrives too late to change anything. Analytics surfaced at the moment someone is choosing which client to prioritize, or which variant of a process to follow, actually shapes outcomes.
What KPIs matter for knowledge worker analytics?
Traditional productivity metrics (units processed, calls handled) don’t translate to knowledge work, where the same hour can produce a rejected draft or a deal-closing insight. The KPIs that matter instead measure decision quality, synthesis speed, and knowledge reuse.
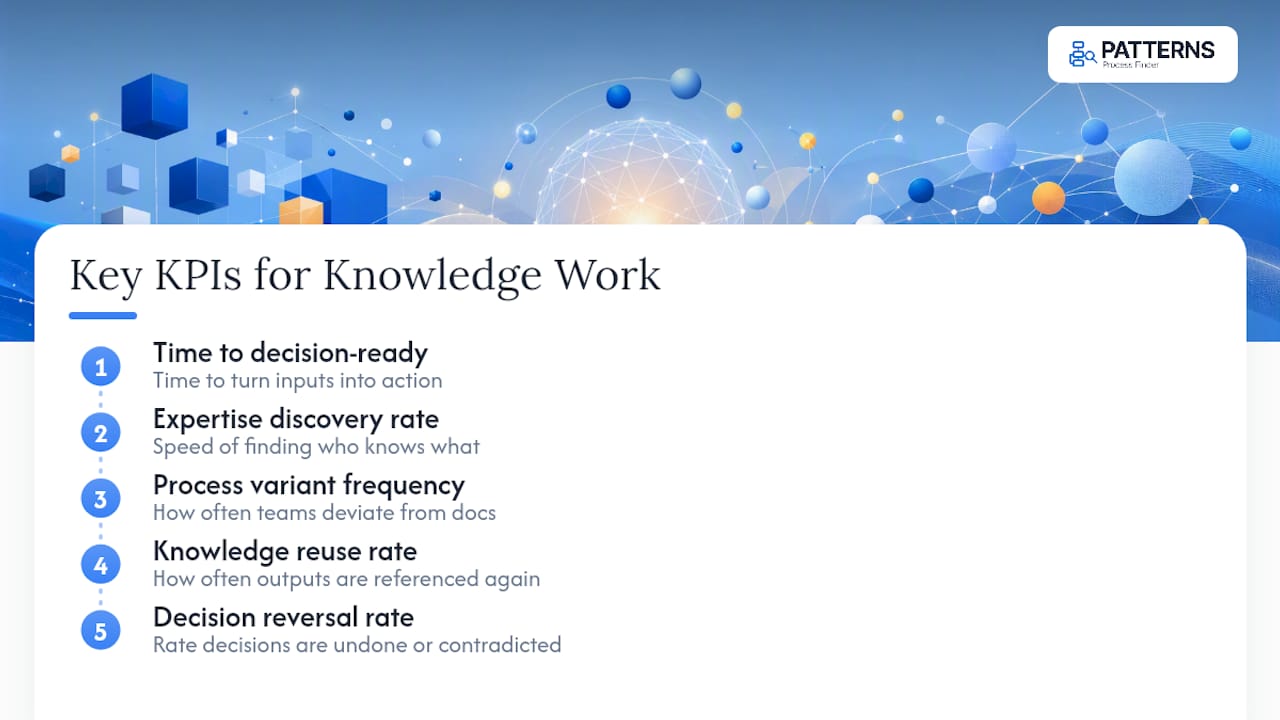
Time to decision-ready synthesis tracks how long it takes to turn raw inputs (interview notes, reports, customer feedback) into something a decision-maker can act on. This is where AI-assisted synthesis shows the clearest measurable gains, per the time-reduction findings from generative AI field experiments.
Expertise discovery rate measures how quickly teams identify who actually knows something, versus who’s listed as the owner. Slow discovery is a hidden tax on every cross-functional project.
Process variant frequency counts how often teams deviate from documented steps, a strong early signal for where automation will fail if built on the official version instead of the real one.
Knowledge reuse rate tracks whether documents, decisions, or analyses get referenced again, versus created once and forgotten. Low reuse usually means the knowledge wasn’t discoverable when it was needed.
Decision reversal rate flags how often decisions get undone or contradicted within a set window, a proxy for whether the underlying analytics genuinely improved judgement or just added confidence to a bad call.
None of these replace output metrics entirely. They sit alongside them, aimed specifically at the parts of knowledge work that a spreadsheet of ticket counts will never capture.
Where has this actually worked?
The clearest evidence of impact so far comes from narrowly scoped pilots rather than from sweeping organizational transformations, and that’s a useful pattern to notice. Field experiments testing generative AI on defined knowledge tasks, drafting, summarizing, document review, consistently show measurable time savings on the specific tasks tested, because the scope was tight enough to measure cleanly.
Microsoft’s Work Trend Index research describes a related pattern: successful analytics-driven change tends to start with a small group of “frontier professionals” who redesign their own workflows first, and organizations then use analytics to identify and scale those redesigned practices across other teams, rather than mandating a new process top down. The workers doing the work find the improvement; analytics confirms its real and repeatable elsewhere.
That sequencing matters more than most rollout plans account for. Organizations that try to deploy knowledge worker analytics everywhere at once tend to generate dashboards nobody trusts, because there’s no baseline proving the new approach beats the old one. Organizations that pilot with a frontier group, measure the delta honestly, including the cases where it didn’t help, and then expand only where the evidence holds, build the credibility that makes later scaling stick. The measurable win isn’t the tool. It’s the discipline of proving the win before scaling it.
Keeping knowledge worker data private and secure
Analyzing how people work raises a legitimate trust problem before it raises a technical one. Employees who suspect their activity data will be used against them stop trusting the systems designed to help them, and that erodes the data quality the whole effort depends on.
Anonymization is the first line of defence. Where the analysis goal is pattern detection, finding process variants, measuring synthesis time, identifying expertise gaps, individual identification usually isn’t necessary. Aggregate and de-identify data by default, and only re-attach identity when a specific, disclosed purpose requires it.
Scope matters as much as anonymization. Behaviour tracking should capture what’s needed to answer the analytics question, not everything technically capturable. Privacy-conscious platforms limit collection to defined activity types rather than full-content surveillance, a distinction worth confirming before adopting any monitoring tool.
Data residency and access controls need explicit ownership. Decide who can query raw activity data versus aggregated reports, and audit that access periodically rather than setting permissions once and forgetting them. Teams evaluating where analytics data lives and who can access it should treat that as a procurement question, not an afterthought.
Transparency closes the loop. Tell employees what’s being measured, why, and what happens with the results, before rollout, not after someone asks. Organizations that skip this step routinely see lower participation and gamed metrics, because workers who don’t trust the system adjust their behaviour to look good on the dashboard instead of working normally.
What’s next for knowledge worker analytics?
The near-term shift is toward tools that keep human judgement active rather than replacing it outright. The Yodeai research on generative AI knowledge tools identified three design requirements gaining traction across the field: adaptable user control, transparent collaboration mechanisms, and integration with a worker’s existing domain knowledge rather than treating every query as a blank slate.
Expect more analytics platforms to expose their reasoning rather than just their conclusions, partly a response to jagged-frontier findings showing that blind trust in AI outputs produces worse decisions on unfamiliar tasks. Provenance tracking, showing exactly what data and what process generated a recommendation, is moving from a nice-to-have to a procurement requirement in regulated industries first, with broader adoption likely to follow.
The freelance knowledge economy is also reshaping what “workforce analytics” needs to cover. With skilled freelance knowledge workers now representing a larger share of the U.S. workforce than a year earlier, organizations increasingly need analytics that spans employees and contractors consistently, rather than tracking one group closely and the other not at all.
Process discovery tools that generate documentation directly from captured execution, rather than relying on workers to self-report their own workflows, are likely to become the default data source feeding these systems, simply because self-reported process maps have never reliably matched reality.
Priorities and pitfalls from an operator’s view
The mistake I see most often is investing in dashboards before investing in exception capture. Vanity metrics, activity counts, login frequency, tell you someone was busy. They don’t tell you where a process breaks or which variant actually works. Prioritize provenance: know where a data point came from before you build a decision on top of it. If you’re piloting analytics this quarter, pick one team, one decision, and measure whether the analytics changed the outcome, not just the reporting.
— Malek
How Patterns Process Finder helps you get there
Everything covered here, exception capture, process variant detection, living documentation that doesn’t go stale, addresses the problem these tools aim to solve. Instead of asking teams to self-report how they work, some solutions record real desktop and browser activity and turn it into SOPs that update automatically as workflows change.
That matters because most analytics efforts stall on bad input data: process maps that describe the intended workflow, not the one with four undocumented exceptions your best analyst runs by memory. This gap can be closed with privacy-conscious tracking and automated discovery designed specifically to surface the hidden variations that cause automation projects to fail. If you’re ready to see what your own teams’ real workflows look like, request a demo or compare Basic, Pro, and Enterprise plans to find the fit for your automation goals.
Sources
- Navigating the jagged technological frontier: Field experimental evidence of the effects of AI on knowledge worker productivity and quality (HBS, 2026)
- Generative AI in knowledge work: design implications for data navigation and decision-making (arXiv 2503.18419)
FAQ
Can anyone become a knowledge worker?
Largely yes, knowledge work depends more on training, judgement, and access to information than on a fixed credential, though most roles do require specific domain expertise gained through education or experience.
What is an example of a knowledge worker?
Analysts, consultants, lawyers, engineers, researchers, and managers who synthesize information to make non-routine decisions all qualify, as do operations leaders who use tools like process mining software to interpret workflow data.
How many knowledge workers are there in the U.S.?
Exact counts vary by definition, but the trend is measurable: skilled freelance knowledge workers alone increased notably as a share of that population in the U.S. between 2025 and 2026, according to Upwork’s data.
What is the difference between an information worker and a knowledge worker?
Information workers perform structured, repeatable tasks with predictable inputs and outputs, like data entry or transaction processing. Knowledge workers handle judgement-heavy, non-routine tasks where the right answer depends on context and synthesis, not a fixed procedure.
What does Patterns Process Finder cost?
Patterns Process Finder offers Basic, Pro, and Enterprise plans, with current pricing details available on the Patterns Process Finder pricing page.