
Visual Process Mapping for Automation Teams: 2026 Guide

Visual process mapping translates how work actually happens into structured diagrams that automation engineers can act on directly. For operations and automation teams in mid-to-large organizations, the primary output is not a pretty chart but a precise, validated artifact: a current-state map that exposes the gap between intended workflow and real execution, paired with a future-state design and the exception register developers need to build reliable automation. Standards like BPMN and SIPOC give those artifacts a shared language, while tools like Processfinder’s Patterns platform automate the discovery work that manual interviews routinely miss.
Table of Contents
- What is visual process mapping and when should you run it?
- Which diagram type fits your audience and use case?
- A practical step-by-step mapping workflow you can run this quarter
- How do visual maps feed automation pipelines?
- What to measure and how to prioritize automation candidates
- Manual diagramming vs. automated discovery: which approach fits your team?
- Best practices, governance, and pitfalls to avoid
- Your sprint checklist and the artifacts to hand off
- Key Takeaways
- The gap nobody talks about in process mapping
- How Processfinder’s Patterns platform accelerates this work
- Useful sources and further reading
What is visual process mapping and when should you run it?
Visual process mapping creates step-by-step visual representations of workflows to identify inefficiencies, bottlenecks, and redundancies. The critical distinction for automation teams is the difference between two map types: the current-state map (how the process runs today, including every workaround and exception) and the future-state map (the optimized or automated target state). Skipping the current-state map and designing directly for the future state is one of the most common reasons automation projects fail at the implementation stage.
Run a mapping exercise when you see any of these signals:
- Automation failure rate is climbing and root cause is unclear
- A process has frequent manual handoffs between systems or teams
- Exception handling consumes more time than the standard path
- A compliance audit or new regulatory requirement demands documented evidence
- A new RPA or pipeline initiative is being scoped
Expect three concrete outputs from any mapping sprint: a validated current-state diagram, a baseline metrics snapshot (cycle time, exception rate, rework frequency), and a documented list of subprocess variations and edge cases.
Pro Tip: Tailor map fidelity to the audience. Executives need a high-level SIPOC or value-stream view; automation engineers need a BPMN or annotated flowchart with decision rules and system touchpoints. Producing one map for both audiences wastes time and confuses both.
Which diagram type fits your audience and use case?
Process mapping techniques vary by objective, and choosing the wrong notation for the wrong audience is a fast path to maps nobody uses. The table below matches each diagram type to its primary stakeholder and appropriate level of detail.

| Diagram Type | Best For | Stakeholder | Detail Level |
|---|---|---|---|
| Flowchart | Simple linear processes, quick scoping | All audiences | Low to medium |
| Swimlane diagram | Cross-functional handoffs, accountability gaps | Operations, process owners | Medium |
| SIPOC | High-level scoping, executive alignment | Executives, sponsors | Low |
| Value stream map | End-to-end cycle time, waste identification | Operations, lean teams | Medium |
| BPMN | Technical handoff to developers, complex exception logic | Automation engineers, RPA developers | High |
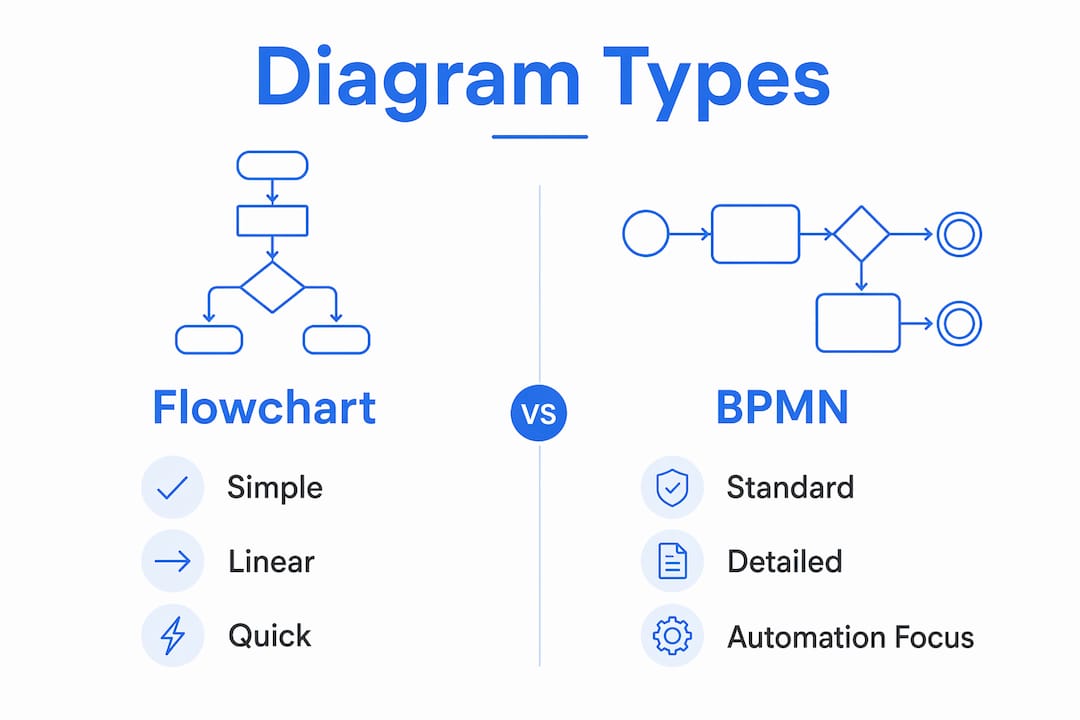
BPMN deserves a specific note: it is the recognized standard for automation handoffs because it encodes decision gateways, event triggers, and exception paths in a notation developers can interpret without ambiguity. That precision is exactly what makes it the wrong choice for an executive alignment meeting. Use BPMN when the map is heading to an automation developer; use SIPOC or a swimlane when the goal is stakeholder buy-in.
A practical step-by-step mapping workflow you can run this quarter
A well-run mapping sprint moves from scope alignment to automation-ready artifacts in roughly two to four weeks, depending on process complexity. The sequence below is repeatable and time-boxed.
- Scope and sponsor alignment. Define the process boundaries, name the process owner, and confirm executive sponsorship. Ambiguous scope is the single most common cause of mapping projects that stall.
- Evidence collection. Gather event logs, screen recordings, system reports, and structured interviews with subject-matter experts (SMEs). Logs and recordings surface what actually happens; interviews surface why.
- Create the current-state map. Build the initial diagram from evidence, not from policy documents. Starting at Level 2 or 3 detail and drilling down only where bottlenecks appear prevents analysis paralysis.
- Validate with SMEs. Run a structured walkthrough with the people who execute the process. Expect corrections. Unvalidated maps are guesses.
- Identify exceptions and subprocess branches. Document every deviation from the standard path, including frequency counts. These become the exceptions register handed to developers.
- Design the future-state map. Model the optimized or automated target state, marking which steps are automated, which are human, and which are decision points requiring business rules.
- Create automation-ready artifacts. Produce the BPMN diagram, exceptions register, sample event-log excerpts, and a curated test-case set for the automation team.
| Step | Owner | Estimated Duration |
|---|---|---|
| Scope and sponsor alignment | Operations lead | a few days |
| Evidence collection | Business analyst, process owner | several days |
| Current-state map creation | Business analyst | a few days |
| SME validation | SMEs, process owner | a short period |
| Exception identification | Business analyst, automation lead | a short period |
| Future-state design | Operations lead, automation architect | several days |
| Automation artifact creation | Automation engineer, business analyst | several days |
How do visual maps feed automation pipelines?
Maps become executable inputs when they include four elements: decision rules, exception paths, system touchpoints, and inputs/outputs at each step. A diagram that shows only the happy path gives developers an incomplete picture and guarantees rework during the build phase.
When handing off to RPA or automation engineers, include a BPMN or annotated flowchart, an exceptions register with frequency counts, sample recordings or event-log excerpts that reproduce decision outcomes, and a curated set of test cases. These four artifacts together reduce ambiguity and cut implementation rework significantly.
Business rules capture is where most manual mapping efforts fall short. Developers need to know not just what happens at a decision point but why, including client-specific rules and threshold values that experienced employees apply instinctively. Pairing the map with actual screen recordings or event-log excerpts gives developers a reproducible reference that no interview can fully replicate.
Pro Tip: Structure maps for iterative automation sprints. Automate the highest-frequency standard path first, validate it in production, then tackle the top exception branch in the next sprint. Trying to automate every edge case before go-live is a common cause of delayed launches.
What to measure and how to prioritize automation candidates
Priority score = frequency × exception rate ÷ automation effort. High-frequency processes with elevated exception rates and low technical complexity rank first. That formula keeps prioritization objective and defensible when presenting to leadership.
| Signal | What It Measures | Why It Matters |
|---|---|---|
| Cycle time | End-to-end duration per case | Baseline for improvement measurement |
| Frequency | Volume of process executions per period | Scales the ROI of any improvement |
| Exception rate | Percentage of cases deviating from standard path | Predicts automation complexity and failure risk |
| Rework loops | Steps repeated due to errors or missing data | Indicates data quality or handoff problems |
| Automation failure rate | Percentage of automated runs requiring human intervention | Signals map or rule incompleteness |
| Compliance/safety impact | Regulatory or safety exposure per deviation | Elevates priority regardless of volume |
Measure baseline metrics before any automation goes live. Without a pre-automation baseline, you cannot demonstrate ROI or diagnose regressions when failure rates change.
Manual diagramming vs. automated discovery: which approach fits your team?
Pick automated discovery when you need scale, reality-based variation capture, and living SOPs. Pick manual mapping for rapid scoping and stakeholder alignment sessions where the goal is shared understanding rather than precision.
Manual and collaborative diagramming tools (such as Lucidchart for layered current/future-state views or Miro for AI-assisted draft generation from notes) work well for initial scoping and executive workshops. Their limitation is that they capture what participants say happens, not what system logs confirm actually happens.
Automated process discovery (Processfinder’s Patterns platform) records real user actions across desktop and browser applications, surfaces hidden subprocess branches and client-specific rules, and generates continuously updated SOPs. This is particularly valuable for capturing rarely observed branches that manual interviews consistently miss, reducing rework during the automation build phase.
Automated discovery is strongest when the process has high variation, when SME interviews have already produced conflicting accounts of how the process runs, or when a previous automation attempt failed due to undocumented exceptions.
BPM suites integrate diagramming with workflow execution and monitoring, making them useful once a process is mapped and automated but less suited for the discovery phase.
Best practices, governance, and pitfalls to avoid
Treat maps as living assets, not one-time deliverables. The value of a process map degrades quickly when the underlying process changes and the diagram does not.
Do:
- Assign a named map owner responsible for updates after each process change
- Version-control diagrams alongside the automation code they document
- Validate maps with SMEs on a defined cadence, at minimum after any system change
- Match detail level to the audience receiving the map
Don’t:
- Over-model at the start; start macro, expose bottlenecks, then drill into subprocesses
- Treat a single workshop output as a validated map without SME sign-off
- Capture individual employee data without masking or aggregating it first
For enterprise security teams: any behavioral or workflow capture tool must align with your data governance policy. Aggregate and anonymize captured user actions before storing or sharing them. Processfinder’s Patterns platform is built with privacy-conscious behavior tracking and integrates with enterprise security protocols.
Pro Tip: Store maps in a shared, version-controlled repository alongside the automation artifacts they generated. When an automation breaks, the first diagnostic step is comparing the current execution log against the validated map.
Your sprint checklist and the artifacts to hand off
Sprint checklist:
- [ ] Scope defined and sponsor confirmed
- [ ] Event logs, recordings, or interview notes collected
- [ ] Current-state map drafted and SME-validated
- [ ] Exceptions register created with frequency counts
- [ ] Future-state map designed and reviewed
- [ ] Automation artifact package assembled
- [ ] Baseline metrics recorded before automation goes live
Artifacts to hand to automation engineers:
- Current-state map (swimlane or annotated flowchart)
- Future-state map (BPMN for technical handoff)
- SIPOC for executive or sponsor review
- Exceptions register with frequency and impact data
- Sample event-log excerpts or screen recordings
- Curated test-case set covering standard path and top exception branches
For teams using Processfinder, the automated documentation tool generates living SOPs and exportable artifacts directly from captured workflow data, cutting the manual documentation step out of the sprint.
Key Takeaways
Visual process mapping delivers reliable automation inputs only when current-state maps reflect real execution, exceptions are documented with frequency counts, and artifacts are treated as living assets updated after every process change.
| Point | Details |
|---|---|
| Current-state first | Map how work actually happens before designing the future state or scoping automation. |
| Match notation to audience | Use SIPOC for executives, BPMN for automation engineers; one diagram rarely serves both. |
| Prioritize by formula | Rank candidates by frequency × exception rate ÷ automation effort to keep decisions objective. |
| Treat maps as living assets | Assign an owner, version-control diagrams, and validate on a defined cadence after system changes. |
| Processfinder for discovery | Patterns captures real user actions and surfaces hidden branches that manual interviews miss, reducing automation rework. |
The gap nobody talks about in process mapping
Most process mapping guides focus on notation standards and workshop facilitation. What they underestimate is the data quality problem sitting underneath every map. A BPMN diagram is only as accurate as the evidence used to build it. When that evidence comes exclusively from interviews and policy documents, the map reflects the organization’s self-image, not its operational reality. Exception branches get omitted because no single SME sees every case. Client-specific rules stay undocumented because they live in the heads of two people who have been doing the job for eight years.
This is precisely why automation failure rates remain stubbornly high even after teams invest in thorough mapping workshops. The map looked complete. The automation was built to spec. Then production revealed fifteen exception paths nobody mentioned in the workshop.
The teams that consistently reduce automation failure are the ones that treat evidence collection as the most critical phase of the sprint, not a preliminary step. Logs, recordings, and system event data are not supplements to interviews; they are the primary source. Interviews explain the why; logs confirm the what. Both are required.
How Processfinder’s Patterns platform accelerates this work
Mapping reality-first is faster when the discovery work happens automatically. Processfinder’s Patterns platform records actual user actions across desktop and browser applications, identifies subprocess variations and client-specific rules that workshops miss, and generates continuously updated SOPs without requiring a manual documentation sprint.
Concrete ways Patterns reduces handoff friction:
- Captures real execution paths, including rarely triggered exception branches
- Auto-generates BPMN-ready documentation and living SOPs from observed behavior
- Surfaces automation opportunity scores based on frequency, exception rate, and complexity
- Integrates with enterprise security and privacy requirements through privacy-conscious behavior tracking
Operations teams that have mapped with Patterns report shorter time-to-automation and fewer mid-build surprises for their RPA developers. Start a free trial or request a demo at the Processfinder process-mining tool page to see how automated discovery fits your current sprint.
Useful sources and further reading
- Atlassian: What Is Process Mapping? — Solid technique reference covering diagram types, living-map principles, and common pitfalls.
- Asana: Process Mapping Steps, Types, and Templates — Practical guidance on staged detail levels and avoiding over-modeling.
- Kissflow: Process Mapping Techniques and Methods — Covers BPMN, swimlanes, and integration with automation platforms.
- Lucidchart: Process Mapping Software — Tool reference for layered current/future-state diagramming and stakeholder collaboration.
- Miro: AI Process Mapping Tool — Useful for AI-assisted draft generation from workshop notes; requires SME validation.
- Processfinder: Process Mining Tool — Automated discovery, real-execution capture, and automation opportunity detection.
- Processfinder: Automated Documentation and Living SOPs — Living SOP generation and exportable automation artifacts from observed workflow data.