
Reduce process inefficiency: quick wins for ops teams
Cut the most damaging process waste first: find the hidden factory and remove wait time. That single move, before you touch automation or standardization, resolves more inefficiency than any other intervention, because most delay comes from work sitting idle between steps, not from work being done slowly.
Start this week:
- Pull your last 90 days of transaction or ticket data and talk to the three people who actually execute the process daily, not their managers.
- Measure the gap between “touch time” (actual work) and total cycle time. The difference is your wait time, and it is usually the bulk of the problem.
- Pick the single process with the highest volume and worst on-time performance, and run a one-week discovery sprint on it before scaling to anything else.
Many organizations complete only 60 to 70% of customer orders on time before any formal intervention, a baseline that usually points to a hidden factory of workarounds nobody has documented. You will know the initial effort worked when cycle time drops measurably or your on-time rate climbs against that same baseline, not when a new dashboard looks nicer.
Key Takeaways
Reducing process inefficiency requires finding hidden wait time and workarounds through data-driven discovery before standardizing and automating what you find.
| Point | Details |
|---|---|
| Discover before you fix | Run a one-week sprint pulling event data and frontline interviews to find the vital few problem processes. |
| Separate wait time from work time | Most delay comes from idle queue time, not slow task execution, so measure both separately. |
| Sequence fixes correctly | Standardize a process before automating it; automating dysfunction just scales the dysfunction faster. |
| Track the right KPI first | Watch cycle time and wait time percentage before anything else, since they expose the real bottleneck fastest. |
| Use event-log discovery for precision | Tools like Patterns Process Finder capture real execution patterns and hidden subprocess rules that interviews alone typically miss. |
Table of Contents
- Common types of process inefficiency and their root causes
- Symptoms that should trigger a process inefficiency investigation
- How to identify inefficiencies: audits versus data-driven discovery
- What to measure and how to quantify inefficiency
- Practical tactics to reduce inefficiency: the implementation playbook
- How to pilot, scale, and sustain process improvements
- Common pitfalls and red flags during process improvement
- Why data-driven process discovery matters
- What a practitioner should prioritize in year one
- How automated process discovery speeds up the fix
- Sources
- FAQ
Common types of process inefficiency and their root causes
Every operations team eventually runs into the same handful of inefficiency patterns. Recognizing which one you are dealing with determines whether you fix it with a policy change, a tool swap, or a full redesign.
- Hidden or ghost processes. Employees build unofficial workarounds, spreadsheets, and side-channel approvals to get work done when the official process does not fit reality. These accumulate quietly until they become the real process, invisible to management. Common inefficiencies include manual rework due to late error detection, waiting and queue time as work sits idle awaiting action, handoff friction causing loss of context between departments, tool mismatch where software is ill-suited to the process causing extra steps, siloed decision-making that delays requests, and variability with inconsistent execution standards leading to unnecessary scrutiny.
Hidden factories deserve special attention because they are the hardest to see on an org chart. They form when [employees create workarounds and unofficial steps](https://lean6sigmahub.com/the-hidden-factory-how-to map-the-work-you-didnt-know-you-were-doing/) that eventually get institutionalized outside the documented process, and nobody notices until an audit or a new hire asks why a step exists. The 60 to 70% baseline on-time rate many firms report before intervention is a direct symptom of this: teams are quietly doing extra work just to hit deadlines that look fine on paper.
Symptoms that should trigger a process inefficiency investigation
You do not need a formal audit to know something is wrong. A handful of recurring symptoms should be enough to justify a closer look.
- Deadlines slip on the same type of request, month after month, regardless of who is assigned to it.
- The same errors get caught and corrected repeatedly, but nobody has changed the upstream step that causes them.
- Two teams doing the same job produce noticeably different cycle times or output quality.
- First-pass yield is low. Work has to be sent back or reworked before it can move forward.
- Queue depths grow steadily in your ticketing or approval system, even when headcount hasn’t changed.
- Staff rely on personal spreadsheets, sticky notes, or informal chat threads to track what the official system should be tracking.
In an office finance team, this often shows up as an invoice approval queue that “always” runs three days behind, and everyone shrugs because “that’s just how it is.” In a digital workflow, it looks like a support ticket that gets reassigned four times before anyone actually resolves it, each handoff adding a full day of latency with zero value added.
Pro Tip: Collect qualitative signals through short, anonymous pulse surveys or informal one-on-ones framed around the process, not the person. Asking “what slows this down?” gets honest answers. Asking “why did this take so long?” gets defensive ones.
How to identify inefficiencies: audits versus data-driven discovery
Two approaches dominate process discovery, and most teams default to the wrong one first.
Manual interviews and workshop-based process mapping are fast to start and require no new tooling. Practitioners talk to frontline staff, sketch the process on a whiteboard, and document what people say they do. The weakness is baked into the method: people describe the process as they believe it should work, and they routinely omit the workarounds and exceptions that make up the hidden factory. Manual documentation and interviews often create a gap between the process on paper and the process in practice, and that gap is exactly where inefficiency hides.
Data-driven discovery, commonly called process mining or event-log analysis, reconstructs what actually happened from system logs, timestamps, and user actions instead of relying on memory. This method reveals waiting, rework loops, and variability that interviews routinely miss, because the data doesn’t forget or self-edit. The trade-off is setup time and access to the underlying system logs, which not every organization has ready to query.
A one-week discovery sprint, in practice:
- Day 1: Scope. Pick one process, one team, and a clear start/end point. Do not try to map the whole department.
- Days 2 to 3: Pull data. Gather event logs, timestamps, or system activity for the last 60 to 90 days, plus a handful of short interviews with the people who actually do the work.
- Day 4: Reconstruct the flow. Overlay what the data shows against what the interviews described. The gaps are your hidden factory.
- Day 5: Report the vital few. Identify the two or three steps causing the most delay or rework, and hand that shortlist to leadership with a recommended next action.
Prioritize what you find using a simple impact-times-effort score, weighted toward volume and automation potential. A workflow audit that captures time and cost per step is the practical method for finding the vital few processes that consume the majority of time and cost, following a map, fix, then automate order. Tasks that are highly repetitive and rule-based tend to carry the strongest automation ROI once standardized, so weight those higher when you’re deciding what to fix first.
Pro Tip: Run the interview and the data pull in parallel, not sequentially. The interview tells you what people believe is happening; the data tells you what’s actually happening. The distance between the two is often the most valuable finding of the entire sprint.
What to measure and how to quantify inefficiency
You cannot improve what you have not measured, and vague impressions of “things feel slow” will not survive a budget conversation. Build your case on a small set of specific metrics.
| Metric | What it shows | How to measure it |
|---|---|---|
| Cycle time | Total elapsed time from process start to finish | Timestamp difference between first and last recorded action |
| Throughput | Volume of completed units per period | Count of finished items divided by time period |
| Wait time % | Share of cycle time spent idle versus in active work | Sum of gaps between steps, divided by total cycle time |
| First-pass yield | Percentage of work completed correctly without rework | Units completed without correction, divided by total units |
| Rework rate | Frequency of items sent back for correction | Reworked items divided by total items processed |
| Cost per transaction | Fully loaded cost to complete one unit of work | Total process cost divided by transaction volume |
Measurement methods vary by how much system data you already have. Event logs from your existing software give the cleanest picture, since every timestamp is already captured. Where logs are unavailable, lightweight time-and-motion sampling (observing a sample of transactions over a set window) gets you close enough to act. For processes with multiple sequential steps, rolled throughput yield (multiplying the first-pass yield of each step together) reveals how quality compounds or erodes across a full workflow.
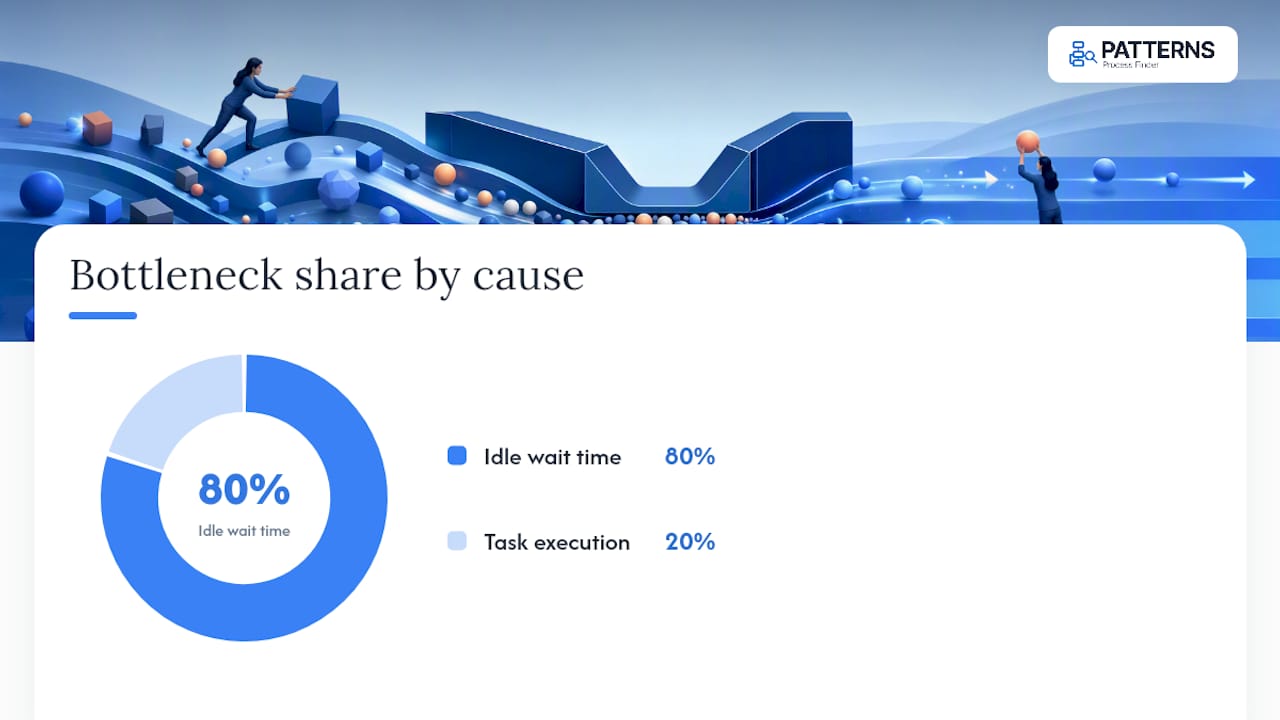
Separate activity time from wait time before you calculate anything else. Roughly 80% of bottlenecks in many processes come from idle wait time between steps rather than slow task execution, so a team that only measures how fast individual people work will miss most of the actual delay. A simple ROI calculation: if a process costs $40 per transaction at 5,000 transactions monthly, and a fix drops cost per transaction to $28, that’s $60,000 in monthly savings, before accounting for faster delivery to customers. Present before-and-after cycle-time charts side by side rather than as a single trend line. Stakeholders grasp a before/after comparison faster than they parse a gradual slope.
Practical tactics to reduce inefficiency: the implementation playbook
Not every fix costs the same or delivers value at the same speed. Rank your tactics by how fast they pay off, and resist the urge to jump straight to the most technically impressive option.
- Remove non-value steps. Any approval, review, or handoff that exists “because it’s always been there” is a candidate for elimination. Time to value: days. Risk: low, provided you confirm the step truly adds no compliance or quality function first.
- Fix handoffs. Assign single ownership across a handoff point instead of letting work bounce between two teams. Time to value: one to two weeks. Risk: low.
- Standardize the process. Document the one correct way to do the task, based on what your discovery sprint actually found, not on assumption. Time to value: two to four weeks. Risk: medium, since people resist change to habits they’ve built workarounds around.
- Add lightweight automation. Automate the rule-based, repetitive steps you already standardized, starting with the highest-volume ones. Time to value: four to eight weeks. Risk: medium, and only worth attempting after standardization is complete.
- Change prioritization rules. Reorder how work enters a queue so the highest-impact items move first instead of processing on a strict first-in-first-out basis. Time to value: days to weeks. Risk: low.
- Increase capacity at the true bottleneck. Add staff, shift hours, or reallocate skilled people specifically to the constraint step, not evenly across the whole team. Time to value: weeks. Risk: medium, cost-dependent.
- Redesign for flow. Rebuild the process end-to-end around continuous flow rather than batch processing. Time to value: months. Risk: high, reserve this for processes where incremental fixes have already been exhausted.
Checklist for each tactic: confirm the fix addresses a step you actually measured (not a guess), assign one owner, set a review date 30 days out, and track the specific KPI that tactic is meant to move.
A common quick win: one operations team facing a three-day invoice approval backlog implemented a simple prioritization rule, routing invoices above a dollar threshold to a dedicated fast lane instead of a single first-in-first-out queue. Approval time for standard invoices dropped from three days to under one, with no new headcount and no new software.
Pro Tip: Never automate step four before you’ve completed step three. Automating a broken, unstandardized process just makes the dysfunction happen faster and harder to unwind later.
How to pilot, scale, and sustain process improvements
A pilot that never scales is a wasted discovery sprint. Structure the pilot so success has an obvious next step built in from day one.
Pilot template:
- Scope: one process, one team, four to six weeks.
- Success metrics: the two or three KPIs from your measurement framework, with a specific target (for example, cycle time down 20%).
- Team roles: a process owner, a data or IT contact for system access, and an executive sponsor who can remove blockers.
- Governance checklist: weekly check-in, a shared tracker of what’s changed, and a documented rollback plan if the pilot underperforms.
Timeline and cost vary by complexity. A low-complexity pilot (a single team, no new software) typically runs four to six weeks with minimal spend beyond staff time. Medium complexity (cross-team handoffs, some tooling changes) runs eight to twelve weeks. High complexity (full process redesign, new automation infrastructure) can run three to six months and warrants a formal business case before you commit.
When you present ROI to stakeholders, keep the deck short: baseline metric versus current metric, cost savings or time savings translated into dollars, the resourcing required to scale, and a realistic timeline. Skip vanity metrics that don’t connect to cost or customer experience. Handoff to ongoing operations should include a named process owner, a monitoring cadence (monthly at minimum), and a clear escalation path if performance regresses after the pilot team moves on. Governance and capability building matter as much as the fix itself when it comes to making gains stick past the pilot phase.
Common pitfalls and red flags during process improvement
Even well-run improvement programs derail in predictable ways. Watch for these patterns early.
- Automating a broken process. Speeding up a flawed workflow just produces flawed output faster. Fix the process first, automate second.
- Measuring the wrong metric. Tracking utilization (how busy people look) instead of flow (how fast work actually moves) rewards the wrong behaviour and hides real bottlenecks.
- Incentivizing only good news. If reporting a problem gets a team blamed instead of supported, problems stop getting reported, and your hidden factory grows larger.
- Skipping frontline input. Leadership designs a “better” process without asking the people who run it daily, and the new process gets quietly bypassed within weeks.
- Chasing utilization over flow. Keeping every worker at 100% capacity looks efficient but actually creates queues, since fully loaded systems have no slack to absorb variability.
Mitigation is mostly about sequencing and honesty: run the audit before the automation project, tie incentives to problem-surfacing rather than problem-hiding, and put a frontline employee on every improvement team, not just as a consulted party. Punitive incentive structures that discourage bad news are one of the most reliable ways to keep a hidden factory hidden indefinitely.
Cultural resistance usually shows up first as passive noncompliance: people nod in the meeting, then keep doing things the old way. The immediate fix isn’t more training, it’s a direct conversation with the resisters about what the new process fails to account for. Often they’re protecting a workaround that solves a real problem your redesign missed.
Why data-driven process discovery matters
Interviews alone consistently understate the scale of process inefficiency, because people describe an idealized version of their own work. Event-log analysis doesn’t have that bias.

Process mining reconstructs the actual sequence of activities from system data rather than self-reported memory, exposing waiting periods, rework loops, and deviations that never make it into a whiteboard session. Industry estimates suggest organizations lose 20 to 30% of annual revenue to undetected process inefficiencies, and process mining interventions have driven 26 to 40% cycle-time reductions once the resulting fixes are applied. That gap between perceived and actual performance is exactly what interviews miss and event logs catch.
Picture a claims-processing team that believed its approval step took roughly a day based on staff interviews. Event-log discovery showed the step itself took under two hours; the other 22 hours were the file sitting untouched in a shared queue, waiting for the next available reviewer. That single insight, a hidden queue rather than a slow task, redirected the entire improvement effort toward staffing and prioritization instead of process redesign.
Pro Tip: Don’t treat interviews and event-log discovery as competing methods. Use interviews to understand why a pattern exists (context, incentives, history) and event logs to confirm where and how much it’s actually costing you. Combined, they’re far more precise than either alone.
What a practitioner should prioritize in year one
If you’re building a process improvement function from scratch, resist the temptation to run five initiatives at once. Pick discovery and one pilot, and get the governance right before you scale anything.
Discovery comes first, always, because every other decision you make depends on knowing where the real problems live rather than where people assume they live. I’d argue most programs fail not because the fixes were wrong, but because the team fixed the process people described instead of the process the data revealed. Spend your first quarter almost entirely on getting that discovery right, even if it feels slow compared to jumping straight to a visible quick win.
The second priority is building light governance before you need it: a named process owner for whatever you pilot, a monthly review cadence, and a clear rule that nothing gets automated until it’s been standardized. Skipping this step is why so many “successful” pilots quietly regress six months later. There’s no team left watching the metric once the project wraps.
Quick wins buy you credibility with leadership; the strategic work is what actually compounds.*
How automated process discovery speeds up the fix
Manual mapping and interview-based audits get you a starting point, but they cap out fast, especially in organizations where the real process spans a dozen systems and three departments. Patterns Process Finder closes that gap by capturing what employees actually do across desktop and browser applications, then turning that captured activity into living, continuously updated SOPs instead of a static document that goes stale the week after it’s published.
That matters most for the exception patterns and client-specific rules that never make it into a workshop whiteboard, precisely the kind of hidden subprocess variation that keeps automation projects failing after launch. Before you commit to any discovery tool, run it through a short evaluation: what data sources does it need access to, how does it handle employee privacy during behaviour tracking, how fast can it deliver a first meaningful insight, and does it integrate with the systems your team already runs on. On that last point, time-to-value for a well-run discovery effort typically lands in the two-to-four-week range; anything dramatically slower usually points to a data-access problem, not a tool problem.
If your team is still relying on interviews and outdated flowcharts to document how work actually happens, Patterns Process Finder’s process mining tool is built to close that gap with real event-level visibility. You can also see how automated workflow capture turns everyday work into living SOPs before requesting a full walkthrough. Start with a demo of Patterns Process Finder to see what your own hidden factory looks like once it’s actually visible.
Sources
- How to find and fix hidden factories | MIT Sloan
- How Process Mining Identifies Hidden Waste in Your Operations – Lean Thinking & Six Sigma
- Workflow Audit: Find the 20% That Wastes 80% | peppereffect
- 5 levels of process intelligence every Lean Six Sigma black belt must master | ILSSI
- How midsize companies can maximize growth and efficiency | Harvard Business Review
FAQ
What are the most common symptoms of process inefficiency?
Missed deadlines, repeated rework, high variability between workers doing the same task, low first-pass yield, and growing reliance on spreadsheets or side-channel tools instead of the official system.
What can be done to reduce inefficiency?
Run a data-driven discovery sprint to find where wait time and rework actually occur, then standardize the process before adding automation. Tools like Patterns Process Finder can shorten discovery by capturing real workflow execution instead of relying on interviews alone.
How to improve process efficiency?
Separate activity time from wait time, since most bottlenecks come from idle queue time rather than slow work, then target fixes at the true constraint instead of speeding up already-fast steps.
What does process efficiency mean?
Process efficiency measures how much value-adding work happens relative to the total time, cost, and effort a process consumes, tracked through metrics like cycle time, throughput, and first-pass yield.